- QuantNomad's Newsletter
- Posts
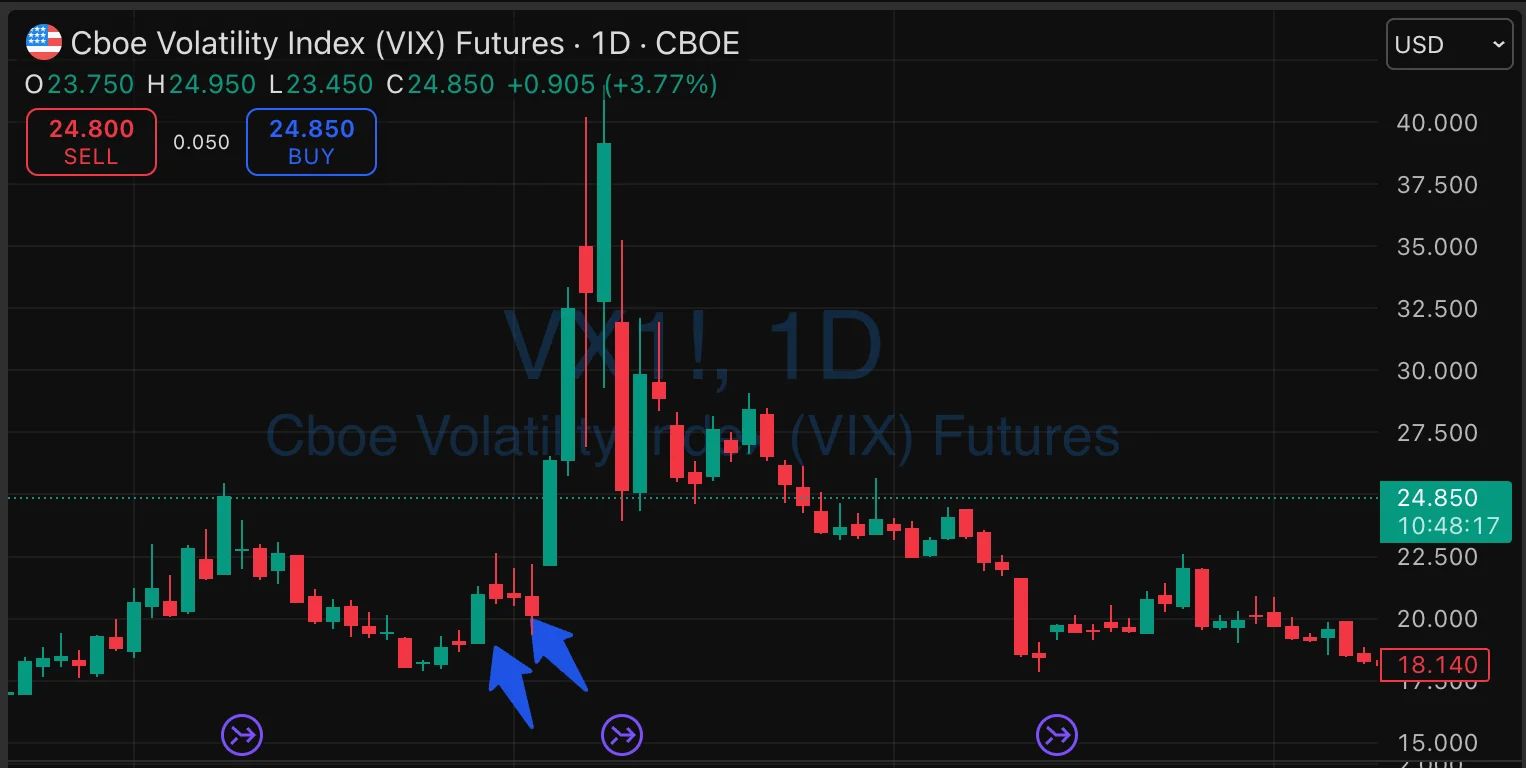
- VIX Curve Compression: A Rare Volatility Setup
VIX Curve Compression: A Rare Volatility Setup
The VIX futures curve is currently in a highly unusual state.
Vadim Cissa
March 20, 2026
At the moment, we’re seeing extreme curve compression, with only about ~0.65 difference between the lowest and highest futures (~0.60 yesterday).
This may not immediately stand out on a chart, but under the surface, it represents one of the flattest VIX forward curves you’ll encounter.
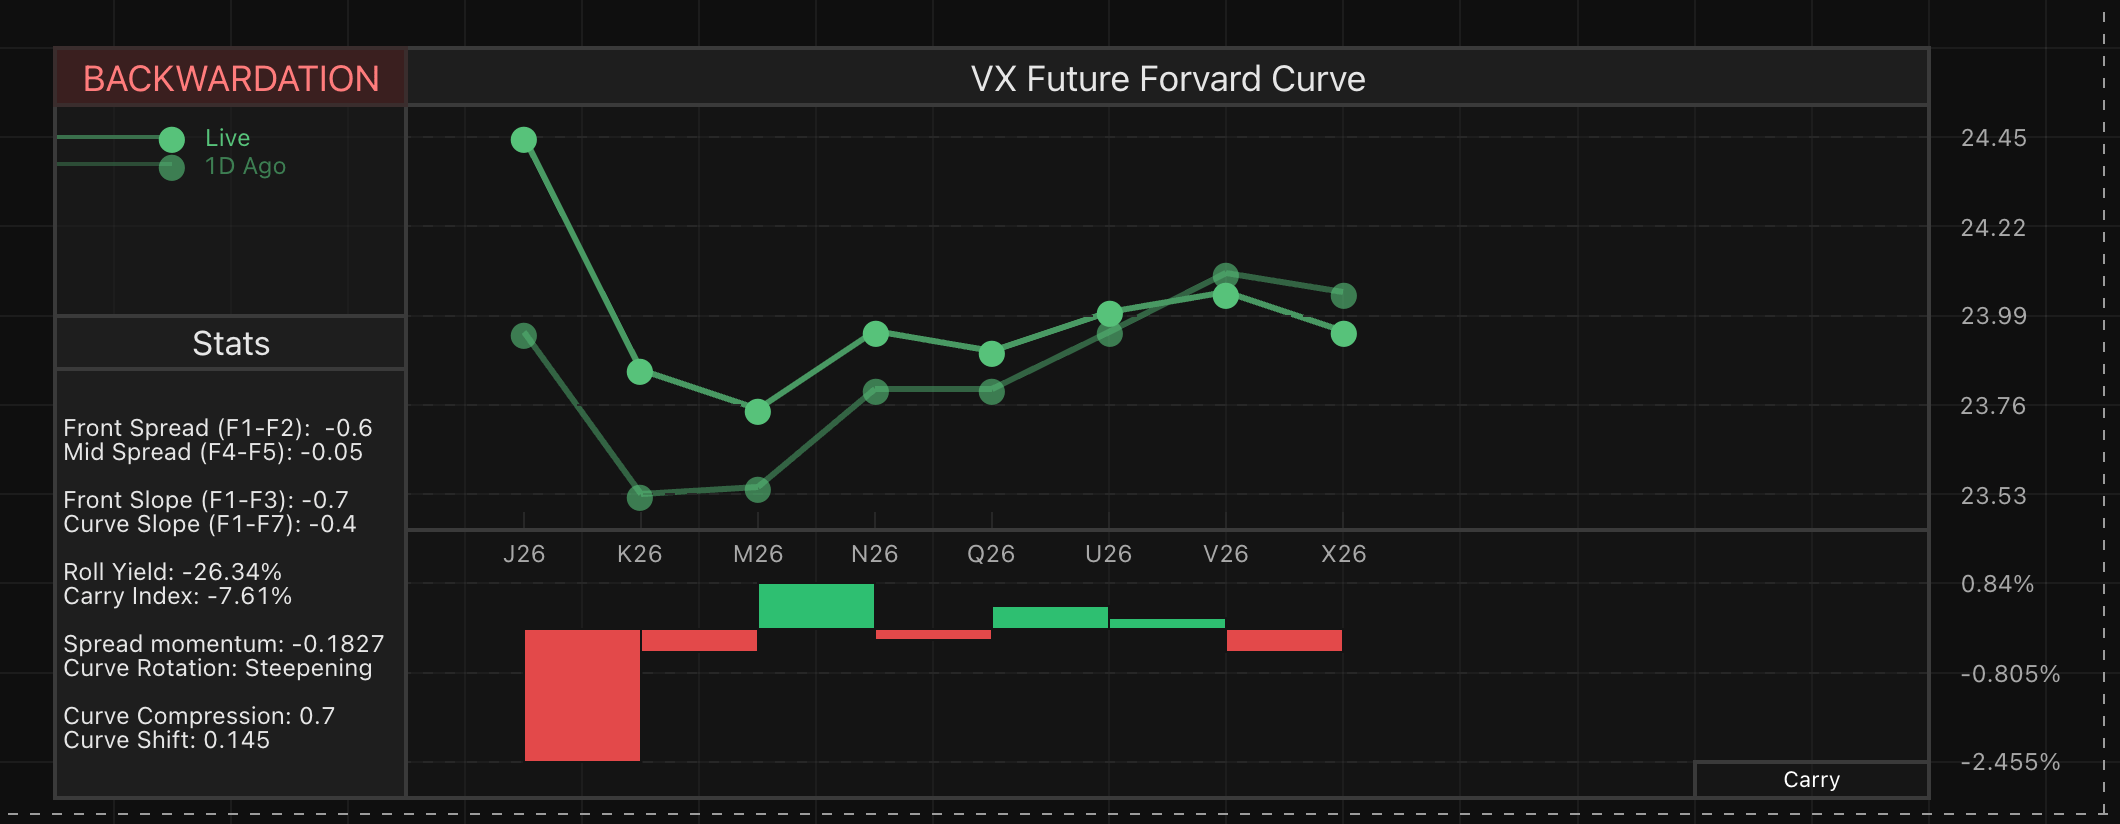
What is Curve Compression?
Curve compression refers to the spread between the highest and lowest points on the VIX futures curve.
In normal conditions, this spread is wider, reflecting differences in how the market prices short-term vs longer-term volatility.
When that spread shrinks significantly — like now — it means:
→ The market is pricing very similar volatility across all maturities
→ There is little differentiation in time horizons
→ Conviction about the future path of volatility is low
Why This Matters
This type of structure is rare.
Looking back to 2004, similar compression has occurred in less than ~2% of trading days (~90 days total).
It tends to appear during transitional regimes, when the market is uncertain whether current conditions will:
Stabilize
Or escalate into something larger
In other words, the market is not calm — it’s undecided.
What Happens Next?
Historically, these compressed regimes don’t last long.
When we look at the forward performance of front VIX futures after such setups, we see:
A wide distribution of outcomes
But importantly, significant upside tails
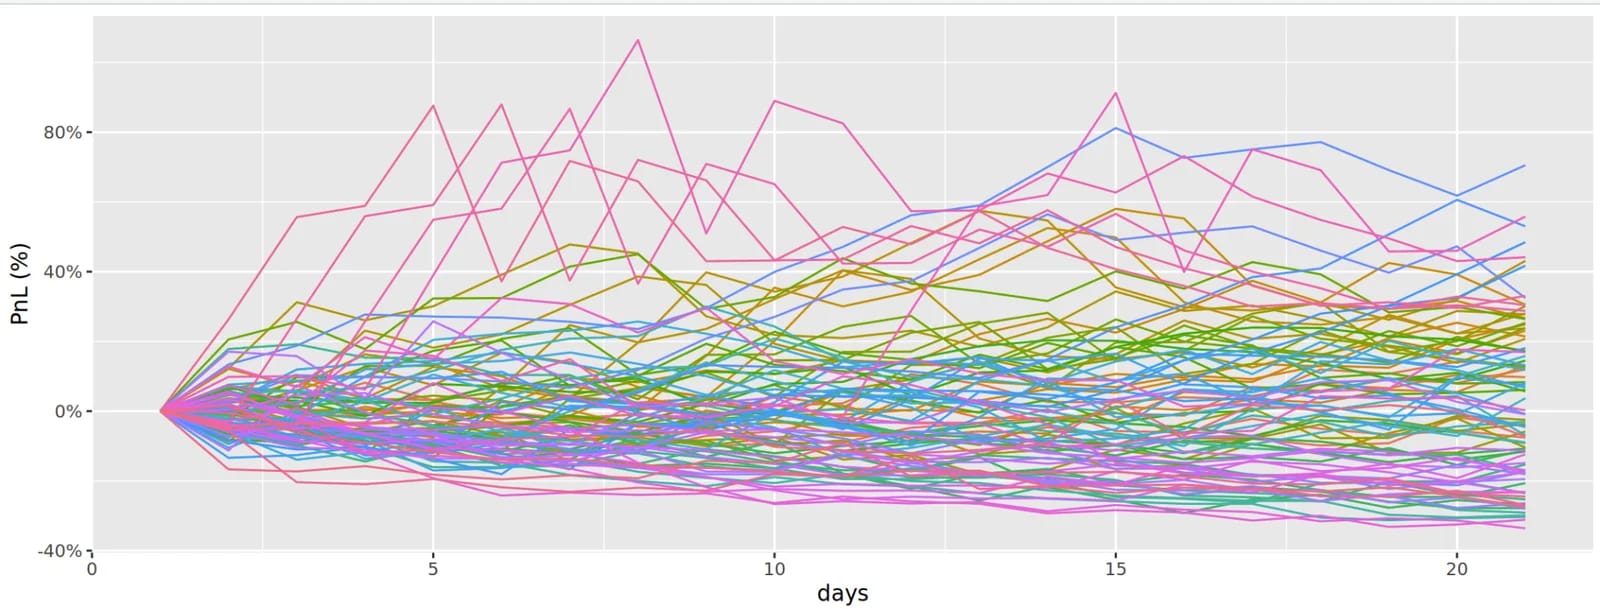
This suggests that while outcomes vary, volatility expansion is a common resolution.
Some notable examples:
November 2007 → pre-crisis volatility surge
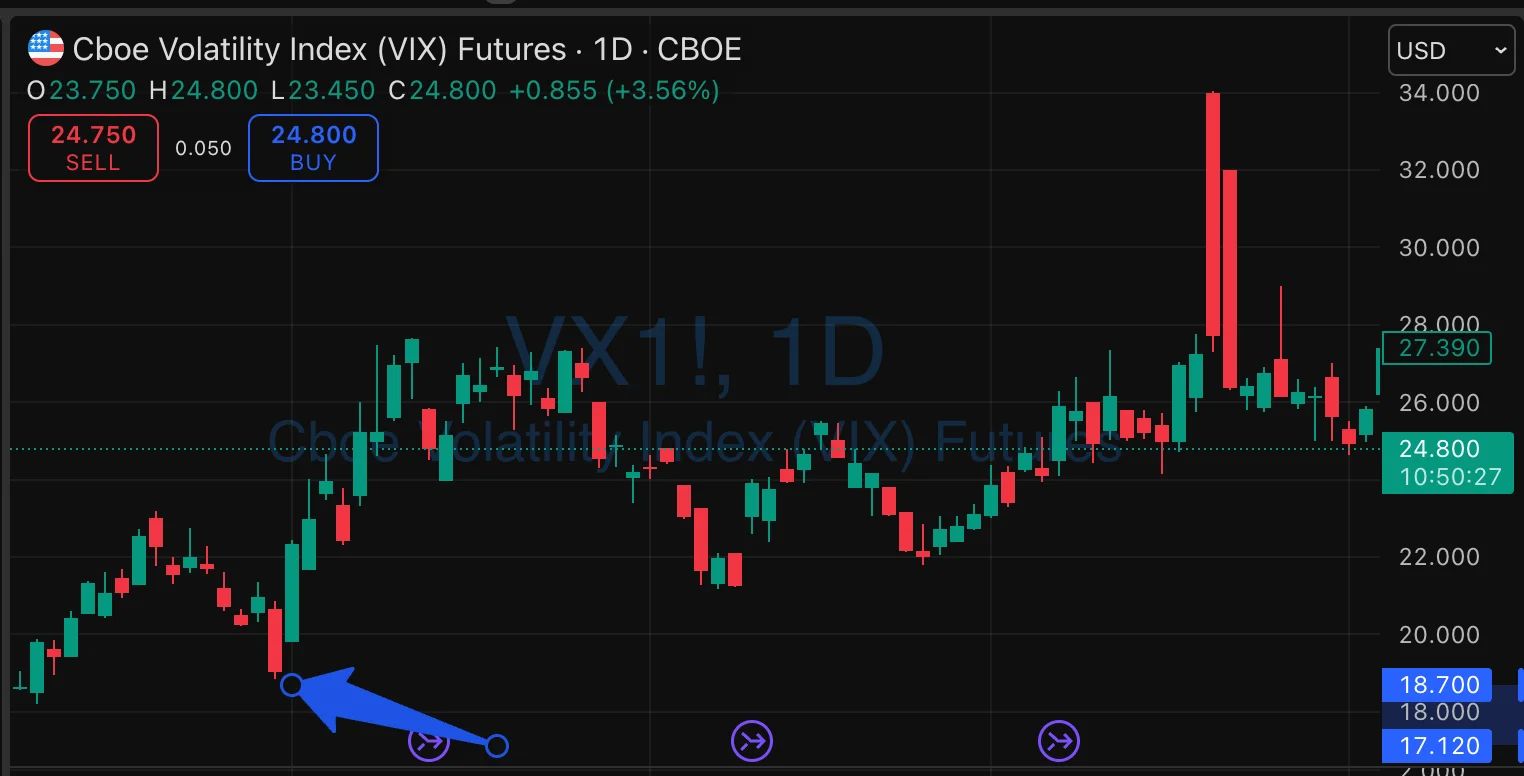
October & December 2018 → sharp equity-driven volatility spike
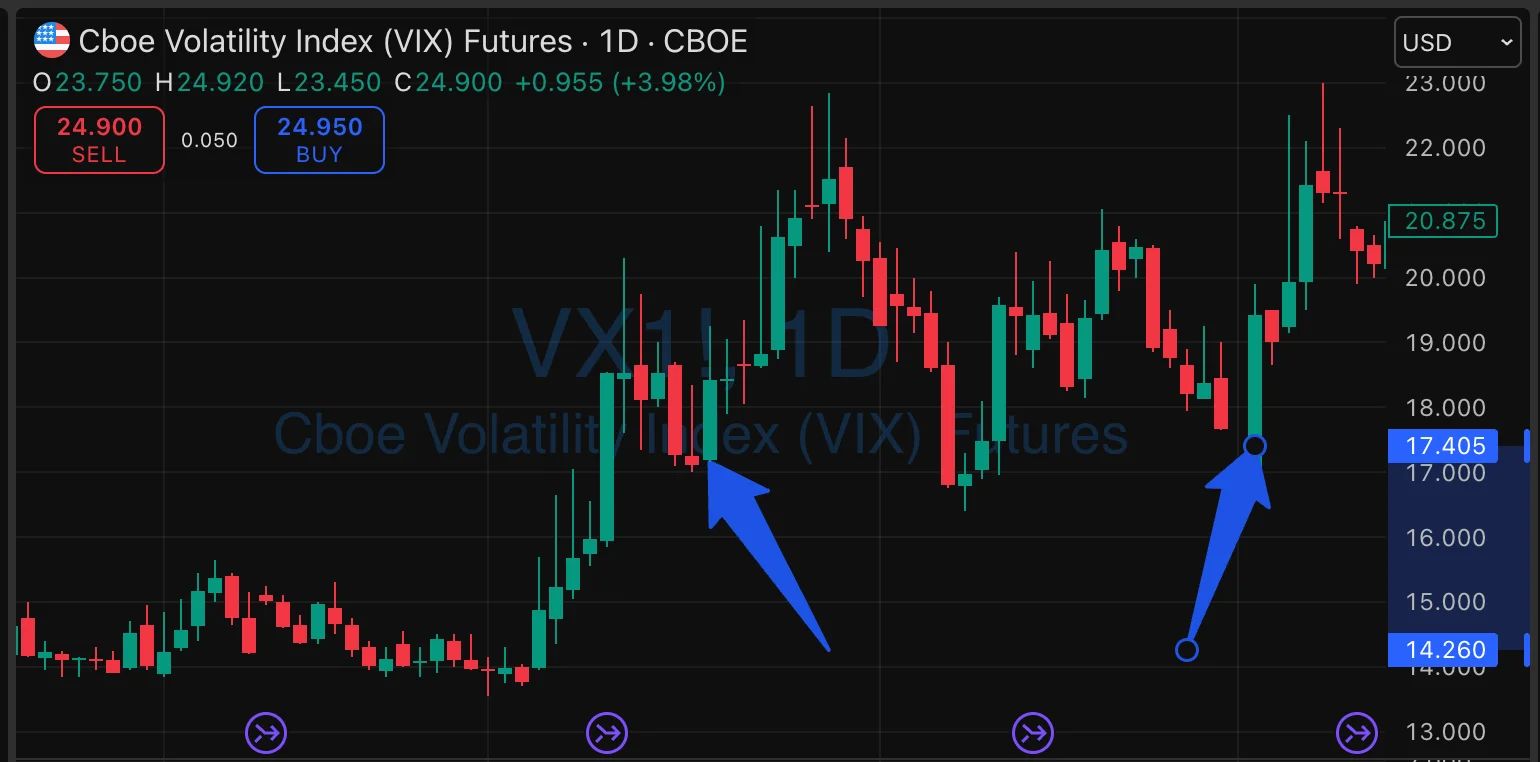
March / April 2025 → recent volatility expansion
Interpretation
A useful way to think about this:
The VIX curve is compressed, but the risk is not.
When the market stops differentiating between short-term and long-term volatility,
it often means that a repricing is coming — the only question is timing.
Final Thoughts
This is not a standalone trading signal.
But it is a rare condition that historically aligns with asymmetric risk toward higher volatility.
And while it’s subtle on the surface,
it’s exactly the kind of structure that deserves attention beneath it.
Attio is the AI CRM for modern teams.

Connect your email and calendar and Attio instantly builds your CRM. Every contact, every company, every conversation — organized in one place. Then ask it anything. No more digging, no more data entry. Just answers.