- QuantNomad's Newsletter
- Posts
- 🛢️ Brent’s Curve Is Screaming
🛢️ Brent’s Curve Is Screaming
The Brent forward curve has moved into extreme backwardation, with the front-month trading nearly $10 above the second contract.
Vadim Cissa
April 03, 2026
The Brent forward curve has moved into extreme backwardation, with the front-month trading nearly $10 above the second contract.
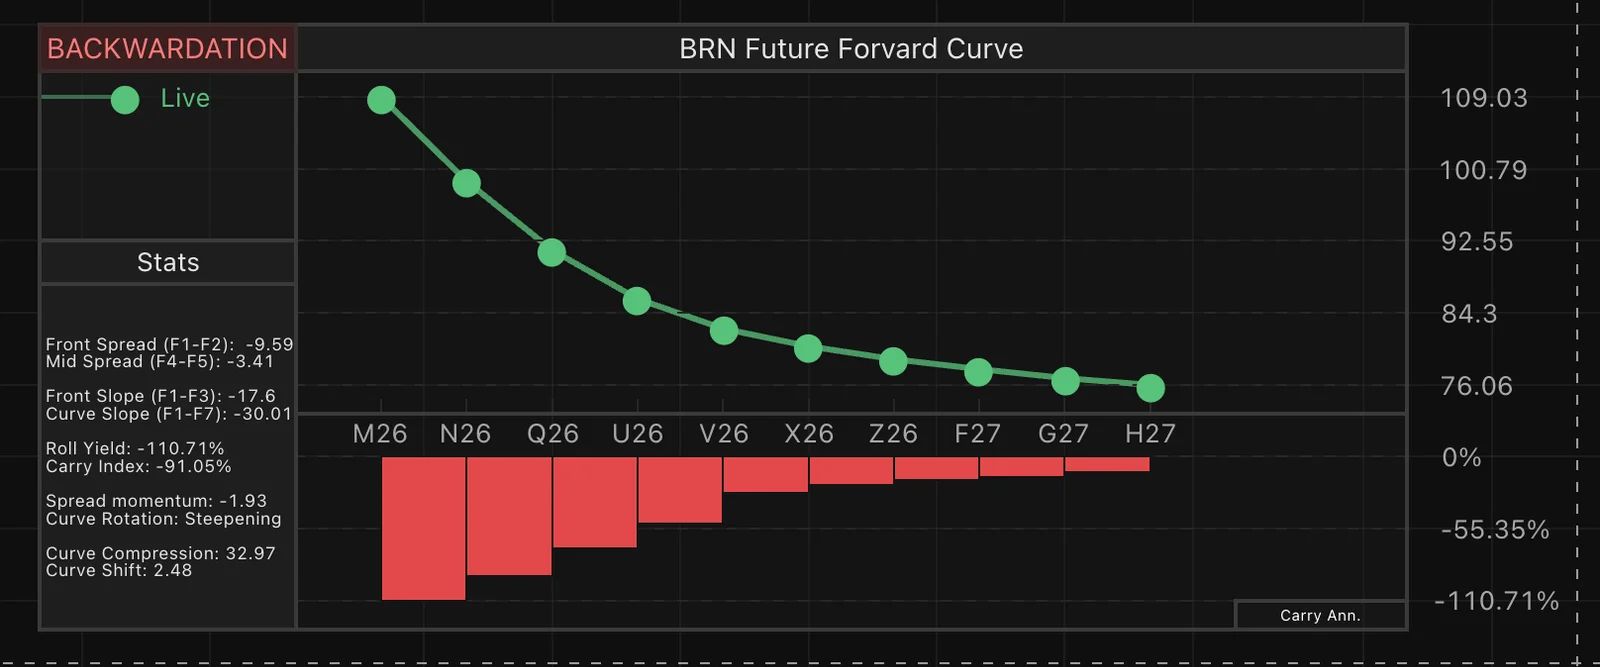
That translates into an annualized roll yield of around -110% — likely the most negative level ever recorded.
For context, similar extremes were only briefly seen in:
March 1991 (Gulf War aftermath)
April 1996
August 2000

Even then, not at this magnitude.
What’s Driving It
This is not a slow tightening — it’s a shock.
The escalation involving Iran and the disruption risk through the Strait of Hormuz — a key artery for global oil flows — has pushed the market into immediate scarcity mode.
And the curve reflects exactly that:
The issue is not future supply — it’s access to barrels today.
Buyers are bidding aggressively for prompt crude, while deferred prices remain anchored by expectations that the disruption may not be permanent.
Why It Matters
A structure like this creates strong incentives:
Long futures positions get punished (massive negative roll yield)
Storage is discouraged
Physical barrels are pulled into the spot market
In other words, the curve is actively reinforcing tightness.
The Takeaway
This isn’t just backwardation — it’s a stress signal.
The oil market is pricing urgency, not just scarcity. And while these conditions can drive sharp moves higher, history suggests they rarely last.
When the front-end pressure eases, the unwind can be just as violent.
Your AI is resolving tickets. Is it keeping customers?

Resolution rates look great. But Gladly's 2026 Customer Expectations Report reveals the metric most CIOs are missing — and what the data says about where AI investments actually translate into retention, not just throughput.